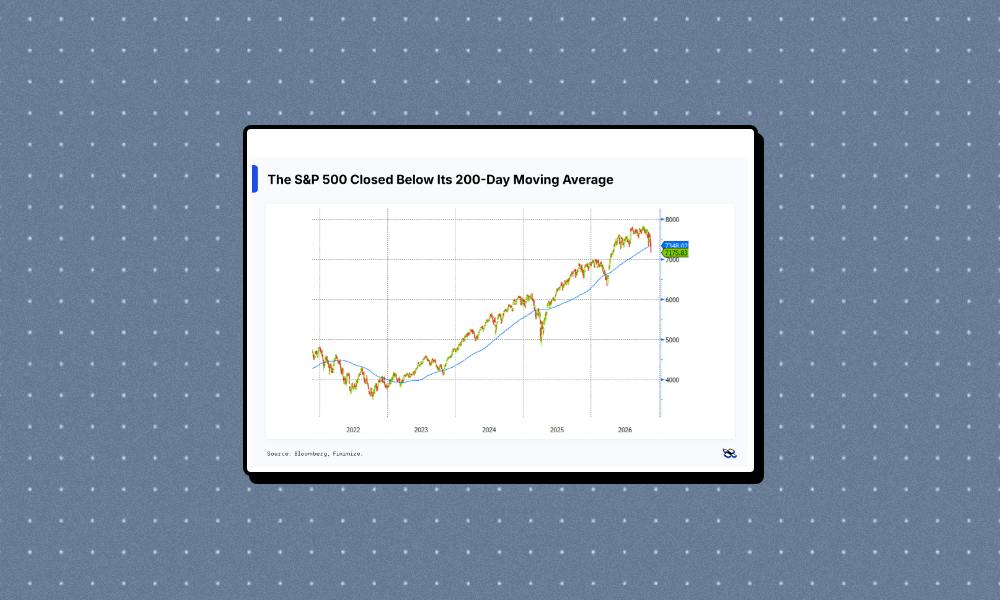
The S&P 500's 200-day moving average is one of the most closely watched lines on any market chart. It's a simple calculation—the average of the index's closing prices over the past 200 trading days—but it carries outsized weight among traders, fund managers, and everyday investors alike.
Why so much attention? Because it smooths out the daily noise and reveals the longer-term trend. When the index is above that line, the market is generally seen as being in an uptrend. When it falls below, it's often interpreted as a warning that momentum is fading and investors are turning more cautious.
What the 200-day average tells you
The moving average is essentially a lagging indicator—it reflects what has already happened rather than predicting what comes next. But that doesn't make it useless. It helps investors step back from the day-to-day swings and focus on the bigger picture.
For example, a single bad day or even a week of losses might not mean much if the index remains above its 200-day average. That kind of brief dip can be dismissed as noise. But if the index closes below that line and stays there, it becomes harder to ignore. Sustained trading below the 200-day average is often seen as a sign that the market's longer-term direction has turned negative.
This line also acts as a psychological dividing line. Many investors and automated trading systems use it as a trigger for buying or selling. When the index is above it, sentiment tends to be bullish; below it, bearish. That can create a self-reinforcing effect, as more investors react to the same signal.
Why it matters for your portfolio
For everyday investors, the 200-day average is a useful tool for gauging the health of the market—not a crystal ball. It can help you understand why the market might be reacting a certain way and what signals professionals are watching.
If the S&P 500 dips below its 200-day average, you might see more volatility as traders adjust their positions. That doesn't mean you should panic or sell everything. But it's a sign that the market could be entering a more cautious phase, and it might be worth reviewing your own risk tolerance and diversification.
It's also important to remember that the 200-day average is just one indicator. Markets can and do recover after falling below it, and staying above it doesn't guarantee gains. But as a barometer of investor sentiment and trend strength, it's a line worth watching.
What to watch next
Investors will be keeping a close eye on whether the S&P 500 can hold above or reclaim its 200-day average. A quick bounce back would suggest the dip was indeed noise. A prolonged stay below it could signal a deeper shift in market sentiment.
Other markets often move in tandem with the S&P 500, so a sustained break below this key level could have ripple effects globally. For instance, recent moves in the ASX 200 and other indices are often influenced by the same trend signals that drive U.S. markets.
In the end, the 200-day moving average is a simple but powerful concept. It distills months of trading into a single line that helps investors separate short-term noise from the long-term trend. Whether you're a seasoned trader or just starting out, understanding this line can give you a clearer picture of where the market stands—and what might come next.