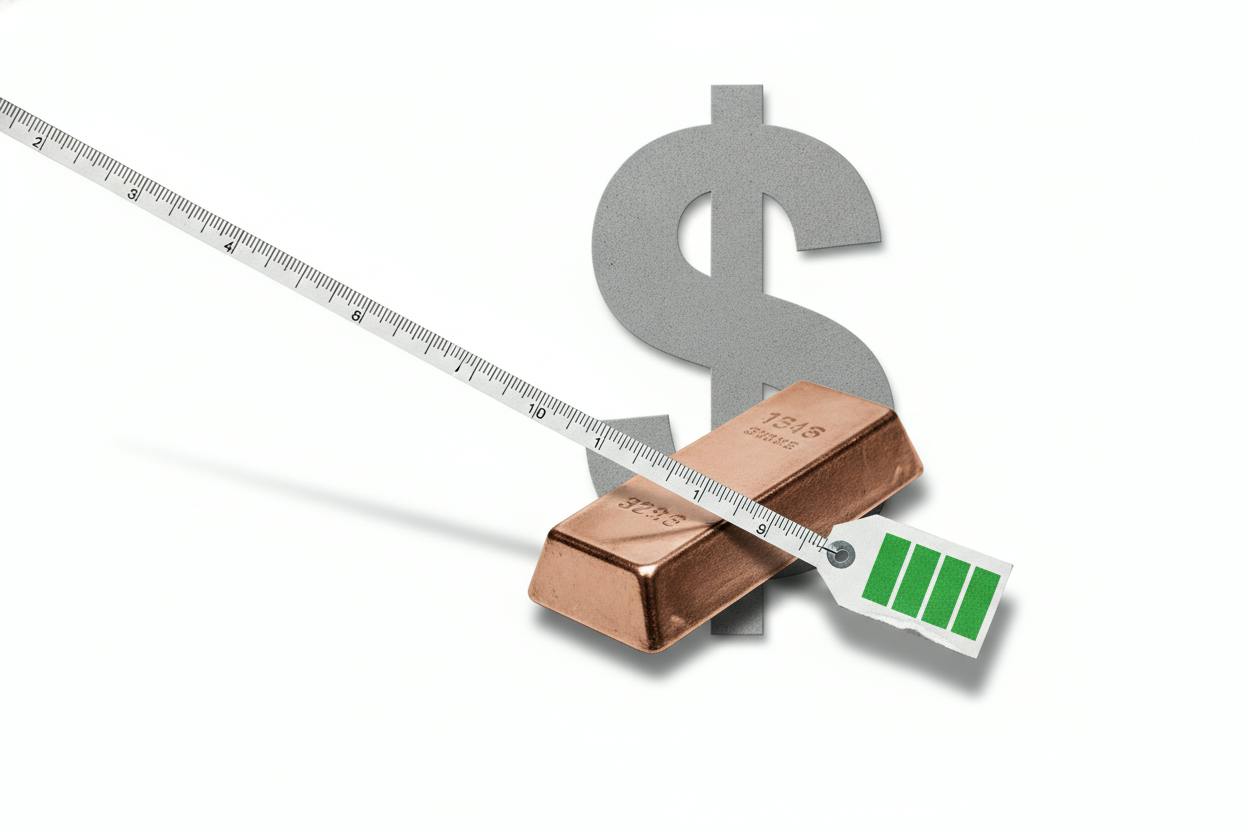
Copper prices tumbled to a seven-month low on [day], extending a losing streak that has now reached five consecutive sessions. The slide comes as a robust US dollar and lingering inflation concerns push traders to offload the industrial metal, with algorithmic trading amplifying the move once widely watched chart levels were breached.
What's driving the sell-off?
The immediate trigger is the strength of the US dollar. When the dollar rises, commodities priced in dollars—like copper—become more expensive for buyers using other currencies, which tends to dampen demand. The dollar has been buoyed by expectations that the Federal Reserve may keep interest rates higher for longer, a sentiment that has also weighed on other metals and global markets.
Inflation jitters are adding to the pressure. Investors worry that persistent price pressures could force central banks to maintain restrictive policies, which would slow economic growth and reduce demand for industrial raw materials. Copper, often seen as a barometer of economic health because of its use in construction, electronics, and infrastructure, is particularly sensitive to such shifts.
The drop has started to feed on itself. London Metal Exchange (LME) three-month copper fell for a fifth straight session, hitting $12,673 a metric ton, while US copper futures in New York also sank. Part of the move is mechanical: when trend-following funds see prices crack widely watched “technical levels”—chart points traders use as buy-or-sell signals—they often sell more, which can drag prices lower regardless of the physical supply-demand picture.
Technical levels and algorithmic trading
Technical analysis is a method some traders use to predict price movements based on historical patterns and chart levels. When prices break below a support level—a price point where buyers have historically stepped in—it can trigger a wave of selling from algorithmic systems that follow trends. These computer-driven strategies are designed to ride momentum, and once a key level is breached, they can accelerate a decline.
This dynamic appears to be at play in the current copper sell-off. The break of these levels has prompted a cascade of selling that may not reflect the underlying fundamentals of supply and demand. For everyday investors, it's a reminder that short-term price moves can be influenced by technical factors and automated trading, not just the physical market.
What it means for investors
For those with exposure to copper—whether through mining stocks, exchange-traded funds, or futures—the recent slide highlights the metal's sensitivity to currency moves and macroeconomic sentiment. A stronger dollar and higher-for-longer interest rates can weigh on commodity prices, even when the long-term outlook for demand remains solid.
Copper is also a key input for the global energy transition, used in electric vehicles, solar panels, and grid infrastructure. That structural demand story remains intact, but it doesn't protect prices from short-term volatility driven by the dollar and algorithmic trading.
Investors should watch the dollar's trajectory and any signals from the Federal Reserve about future rate moves. A softer dollar or a shift in Fed policy could provide some relief for copper prices. Also, keep an eye on technical levels—if prices stabilize above recent lows, it could signal that the selling pressure is easing.
Related coverage: the dollar's recent strength and its impact on gold show how currency moves are rippling across commodities. For a broader view, miners and energy stocks have been dragged lower by the same forces.
As always, it's important to remember that commodity prices are volatile and influenced by a complex mix of factors. While the current slide may be unsettling, it's part of the normal ebb and flow of markets. For long-term investors, the key is to focus on the underlying fundamentals and avoid making impulsive decisions based on short-term price movements.