The Federal Reserve is set to raise interest rates again this week, a move that markets have already priced in. But the real action may come from the central bank's updated economic forecasts, which could hint at a longer or shorter path for borrowing costs than investors currently expect.
According to the latest market pricing, a quarter-point hike is all but certain. That would take the federal funds rate to a range that many economists see as restrictive enough to cool the economy. Yet traders are less sure about what happens after that, and the Fed's own projections may provide the clearest signal yet.
Why the dot plot matters more than the hike
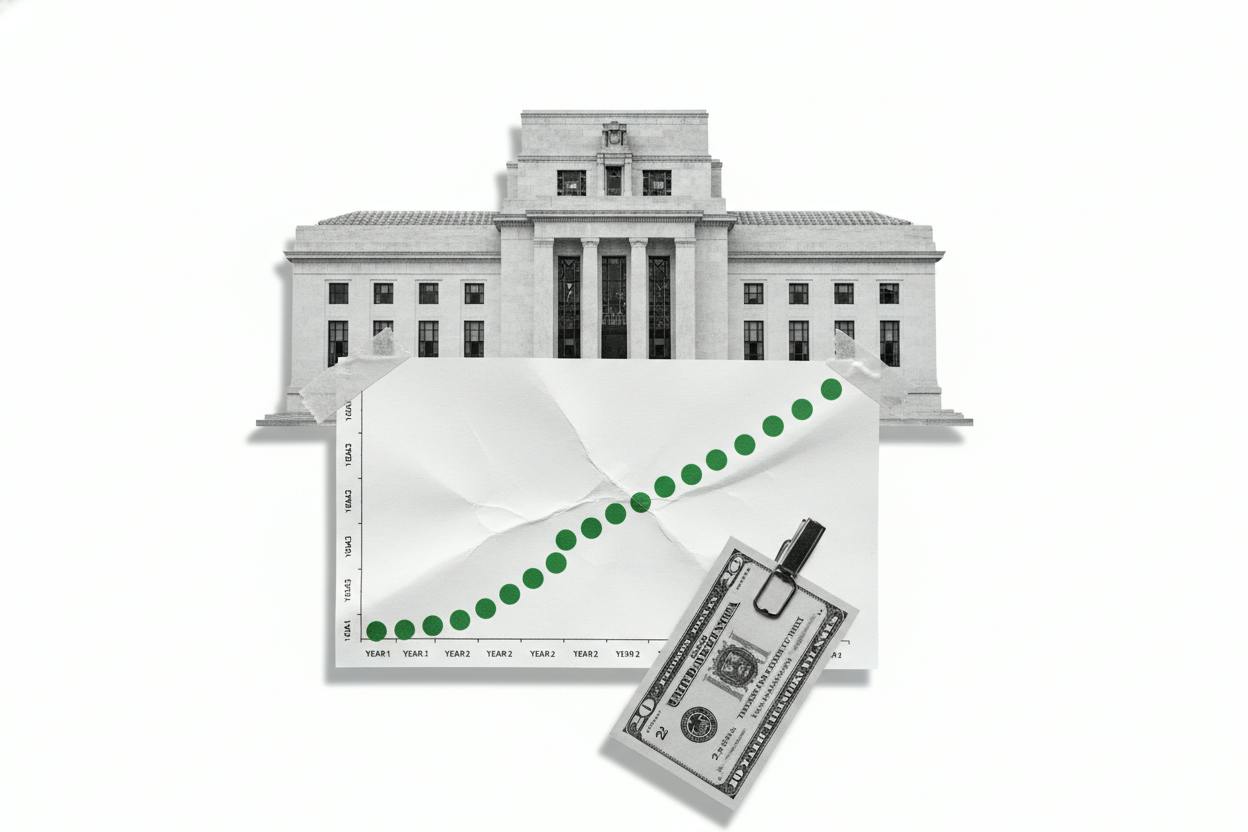
The Fed's Summary of Economic Projections, or SEP, is released alongside each rate decision. It includes the famous "dot plot," a chart where each of the 19 Fed officials places a dot indicating where they expect the federal funds rate to be at the end of each year. The dots are not a promise, but they offer a window into the collective thinking of policymakers.
Because the hike itself is expected, the market's attention will shift to the dots. If the median dot for 2026 moves higher, it would suggest officials see more increases ahead. Conversely, if the dots for 2027 and 2028 show fewer cuts than previously projected, that would imply rates stay higher for longer.
"The SEP is where the real news will come from," said a market strategist. "A small shift in the dots can reset expectations for everything from mortgage rates to corporate borrowing costs."
Inflation remains the key driver
The Fed is still wrestling with stubborn inflation, which has proven stickier than many hoped. While price pressures have eased from their peaks, they remain above the central bank's 2% target. That has left policymakers split between those who want to keep tightening and those who worry about slowing growth.
The updated projections will show how that split is playing out. If more officials pencil in additional hikes for next year, it would signal that the fight against inflation is far from over. If the dots suggest a quicker path to cuts, it could mean the Fed sees enough progress to start easing sooner.
This week's decision comes as other central banks are also moving. The Bank of Japan is expected to hike rates as well, a sign that global monetary policy is diverging. Meanwhile, dollar strength and high oil prices are adding pressure to emerging markets, which could complicate the Fed's outlook.
What it means for investors
For everyday investors, the dot plot matters because it influences the cost of borrowing across the economy. Higher rates for longer mean more expensive mortgages, car loans, and credit card debt. They also tend to weigh on stock valuations, especially for growth companies that rely on future earnings.
If the SEP hints at more hikes in 2026, bond yields could rise, and stocks might pull back. On the other hand, if the dots suggest fewer cuts in 2027 and 2028, that could be seen as a sign the Fed is confident inflation is under control, which might support equities in the long run.
Investors should also watch how the Fed's projections interact with other market forces. For example, emerging markets are already sliding on high oil and AI caution, and a hawkish Fed could add to those pressures. Similarly, AI leaders calling for slower development has introduced new uncertainty into tech stocks, which are sensitive to rate expectations.
The Fed's decision is due Wednesday afternoon, followed by Chair Jerome Powell's press conference. Powell's remarks will be scrutinized for any hints about the future path, but the dots will likely do most of the talking.
For now, the base case is a quarter-point hike. But as the SEP shows, the bigger story is what comes next. Even a small change in the dots can have outsized effects on markets, and investors would be wise to pay attention.