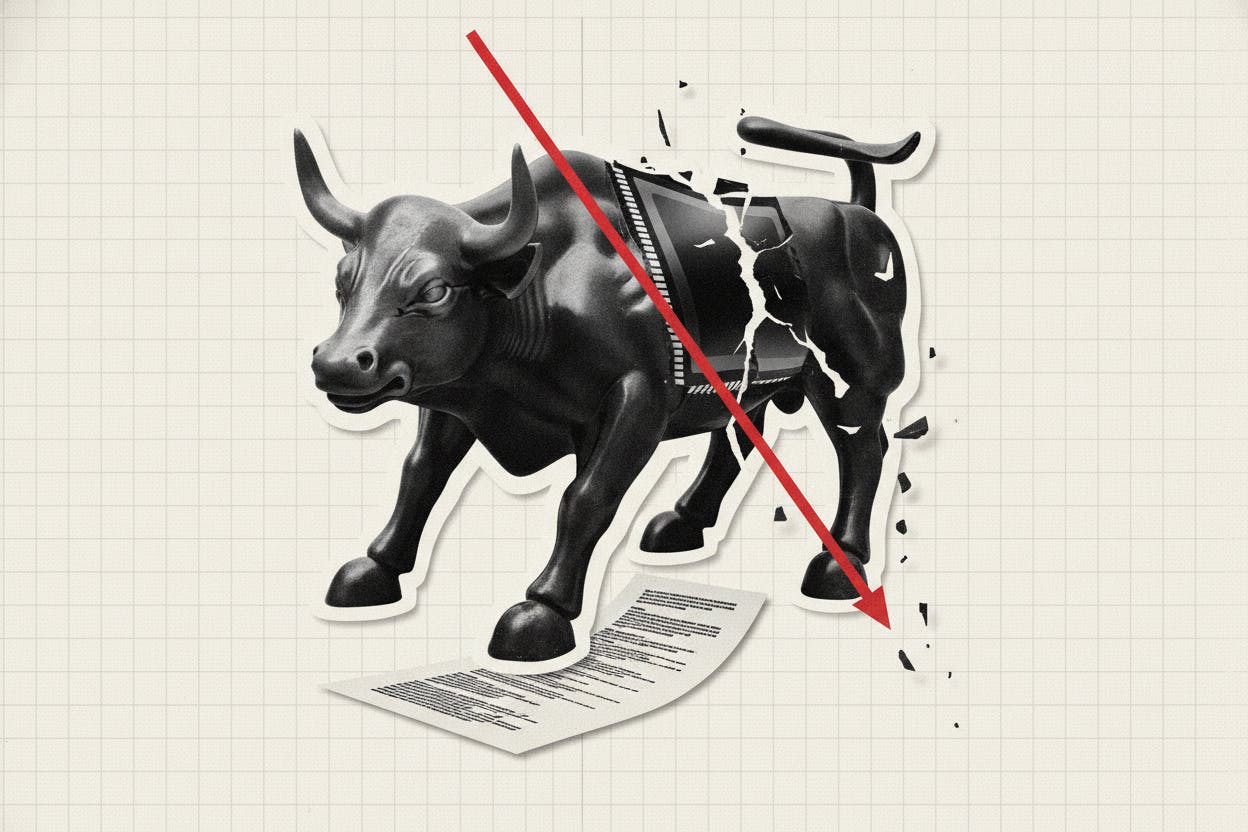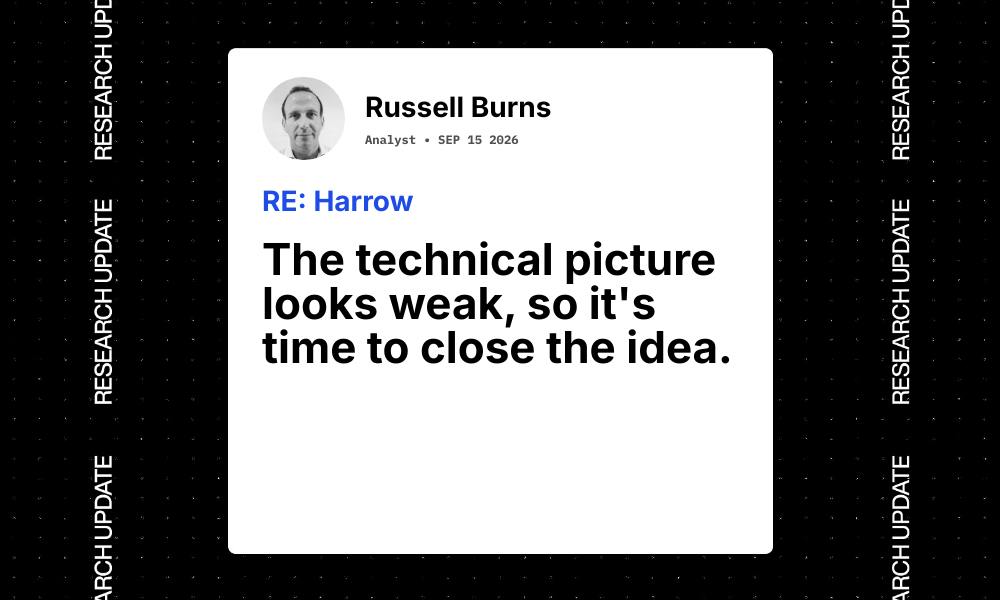
Sometimes the charts tell a story that's hard to ignore. For one technical analyst, that story has reached its final chapter: it's time to sell. The decision isn't based on a single indicator or a gut feeling, but on a combination of price trends, momentum, and a macro environment that's turning increasingly hostile.
Reading the technical tea leaves
Technical analysis is a method of evaluating investments by analyzing statistics generated by market activity, such as past prices and volume. It's not about predicting the future with certainty, but about identifying probabilities and managing risk. The analyst in question uses a toolkit that includes moving averages and the moving average convergence divergence (MACD) indicator.
Moving averages smooth out price data to create a single flowing line, making it easier to see the direction of a trend. Short-term moving averages (like the 20-day) react quickly to price changes, while long-term ones (like the 200-day) provide a broader view. When a short-term average crosses below a long-term average, it's often seen as a bearish signal.
MACD, meanwhile, is a momentum indicator that shows the relationship between two moving averages. It helps traders gauge the strength of a price move. When MACD turns negative or starts to diverge from price, it can suggest that momentum is fading.
In this case, the analyst notes that the underlying analysis is "not inspiring a lot of confidence." That's a polite way of saying the technical picture has deteriorated. Price action over key time ranges is likely showing lower highs and lower lows, moving averages may be flattening or turning down, and momentum indicators are probably pointing south.
The macro headwinds piling up
But it's not just the charts that are flashing warning signs. The broader backdrop is also making it harder to stay invested. The analyst points to higher energy prices, inflationary pressures, and rising bond yields as key headwinds.
Higher energy prices, like those seen in oil and gas, can squeeze consumer spending and raise costs for businesses. Inflation, which has been persistently above central bank targets in many economies, erodes purchasing power and can force central banks to keep interest rates higher for longer. And rising bond yields, particularly on government debt, offer investors a safer alternative to stocks, which can pull money out of equities.
These forces together create a challenging environment for risk assets. When bond yields rise, the discount rate used to value future cash flows also rises, which can lower the present value of stocks. Higher energy costs can hit corporate margins, and inflation can weigh on consumer sentiment. It's a combination that often leads to market volatility and can undermine even the most bullish technical setups.
What it means for investors
For everyday investors, this kind of analysis is a reminder that selling is as important as buying. Knowing when to exit a position can protect gains and limit losses. But it's also important to remember that technical analysis is just one tool. It doesn't guarantee future results, and it can produce false signals.
If you're considering following a similar approach, it's worth understanding your own risk tolerance and investment horizon. Technical signals are often more relevant for short- to medium-term traders than for long-term buy-and-hold investors. A long-term investor might weather a technical breakdown if the underlying fundamentals remain sound.
That said, the current macro environment is worth watching. Consumer confidence has been slipping in some regions as inflation fears persist, which can be a leading indicator for spending and growth. Similarly, rising oil prices are creating tensions in bond markets, as investors weigh inflation against growth.
For those who use technical analysis, the key is to have a clear plan. Set your entry and exit criteria in advance, and stick to them. This analyst has done exactly that, and the signals are now pointing to the exit. It's a disciplined approach that can help remove emotion from decision-making.
The bottom line
When the technical picture and the macro backdrop align, it can be a powerful signal. In this case, both are pointing in the same direction: it's time to say goodbye. Whether you're a trader or a long-term investor, it's a good moment to review your own positions and ask whether your reasons for holding still hold up.
Remember, no analysis is perfect. But when the evidence mounts, sometimes the smartest move is to step aside and wait for a better opportunity. As the analyst puts it, "it's time to call it." For many, that might be the most prudent call of all.