Wall Street is locked in a fierce debate: is the artificial intelligence boom a genuine revolution or a bubble waiting to burst? Bulls argue AI will transform the global economy and justify the trillions being poured into it. Bears see a spending spree that has spiraled out of control. Both sides are convinced they're right.
But conviction can be a trap. Confirmation bias—our tendency to seek out evidence that supports what we already believe while ignoring what challenges it—can cloud judgment. That's a dangerous way to make portfolio decisions. The best investors stay pragmatic and objective, testing their views against hard data.
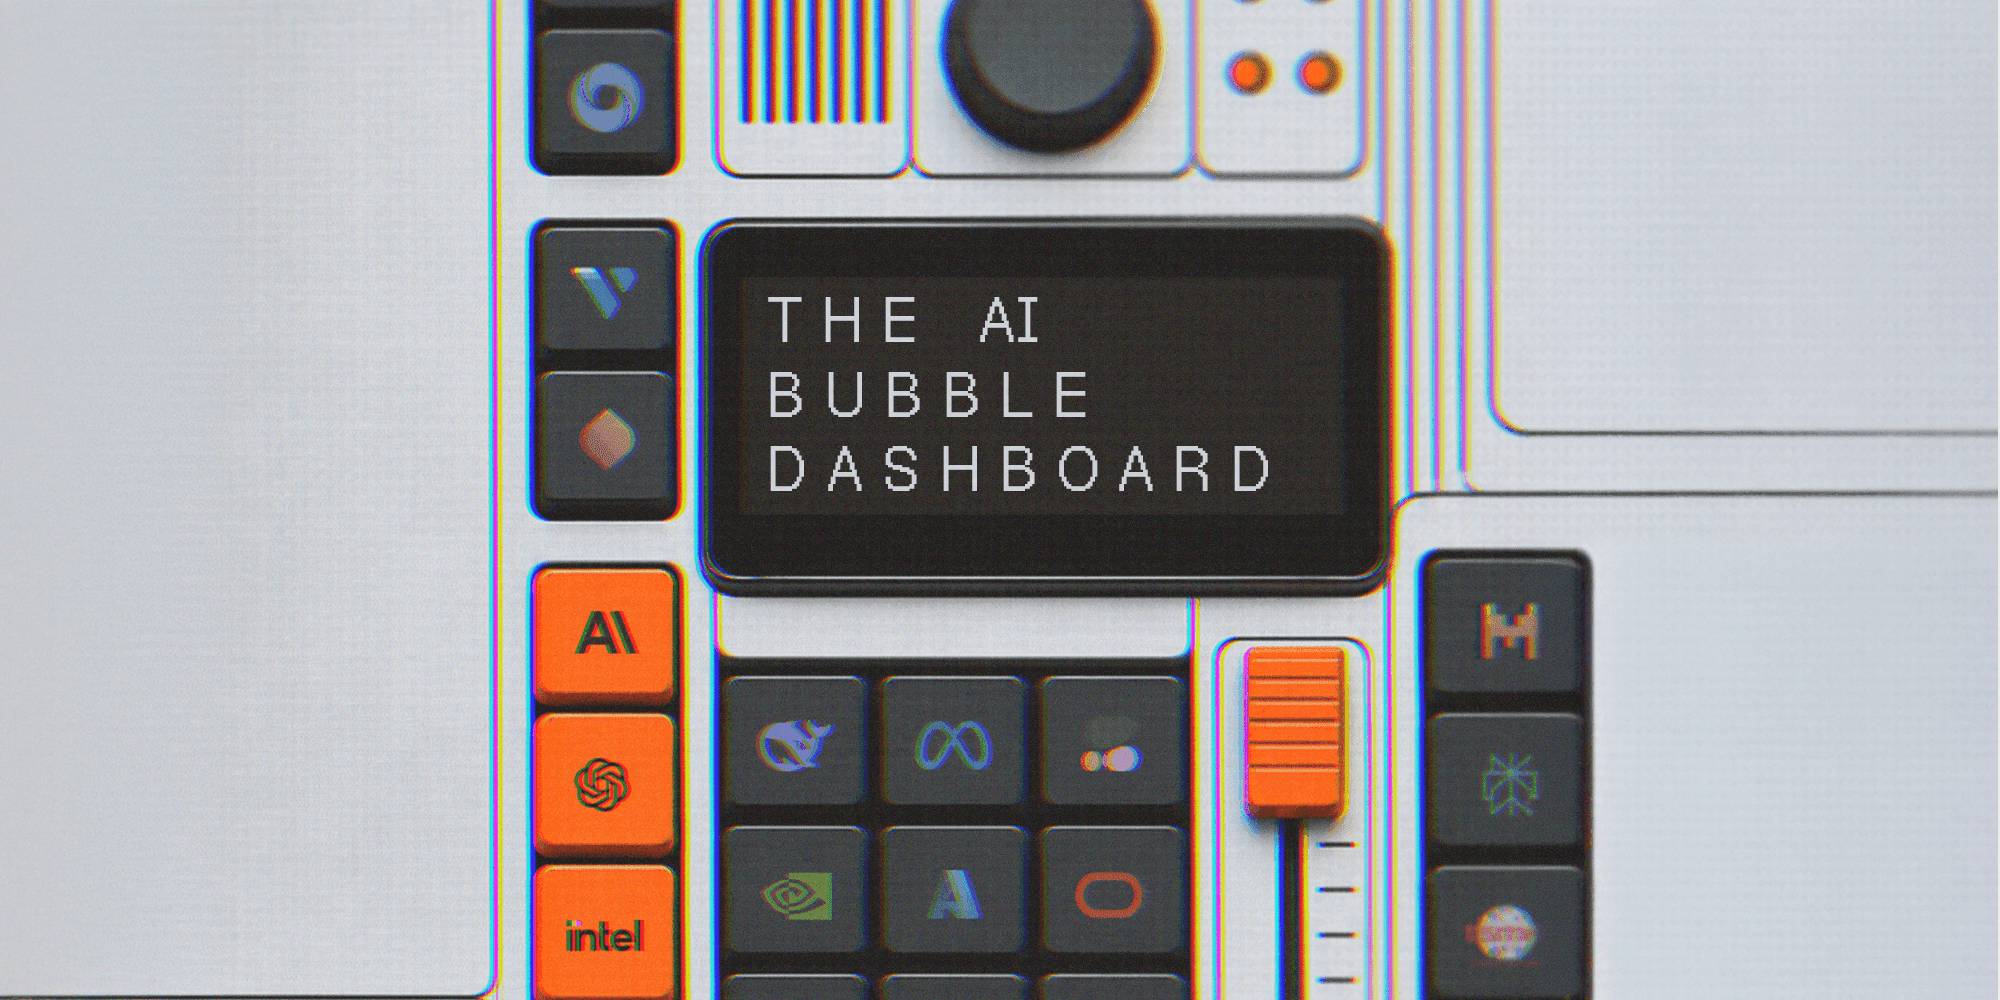
With that in mind, we built the Finimize AI Bubble Dashboard: 30 indicators across five groups—neoclouds, AI model developers, hyperscalers, chipmakers, and the broader stock market. Each group has six metrics, and for each, we note whether a rising reading signals a positive or negative for the AI boom. Here's a look at the first group.
Neoclouds: The New Infrastructure Players
Neoclouds are a new breed of company that emerged to cash in on the AI infrastructure boom. Their model: borrow heavily, issue new shares, and use the proceeds to buy powerful AI chips. They pack those chips into data centers and rent out computing power to companies developing AI.
It sounds lucrative, but it's risky. Building infrastructure costs a fortune, and the economics only work if demand stays strong, rental rates hold up, and financing stays affordable. Here are the key metrics to judge whether that model is working.
GPU Rental Rates
Silicon Data tracks daily rental rates for graphics processing units (GPUs)—the chips that power AI models—across neocloud providers and marketplaces. Rates are measured in dollars per hour. The dashboard follows two Nvidia benchmarks: the H100, launched in 2022, and the newer, more powerful B200, launched in 2024.
Think of neoclouds as a spread business: they buy GPUs, rent them out, and pocket the difference between rental income and financing costs. Higher rental rates mean fatter potential profits. However, many neoclouds have long-term contracts with big customers at fixed prices, often with guaranteed payments whether the chips are used or not. So daily rates don't necessarily reflect existing deals, but they do show what they can charge for spare capacity—and help set prices when contracts come up for renewal.
Rising rental rates are a positive signal for the AI boom, indicating strong demand. Falling rates could signal oversupply or weakening demand—a red flag.
What It Means for Investors
For everyday investors, the dashboard offers a way to cut through the noise. Instead of relying on gut feelings or headlines, you can track concrete data points that reveal the health of the AI ecosystem. For instance, if GPU rental rates start to slide, it might suggest that the AI buildout is ahead of demand—a potential warning sign for stocks tied to AI infrastructure.
It's also worth noting that the broader market context matters. As rising rates could ground stocks despite strong earnings, the cost of capital is a key factor for neoclouds, which rely heavily on debt. Similarly, analysts have flagged export rules and AI spending concerns that could affect chipmakers like Nvidia.
The dashboard isn't a crystal ball, but it provides a structured way to monitor the boom. By watching these 30 indicators, investors can stay informed and make decisions based on data, not just conviction.
In the coming weeks, we'll dive into the other groups—AI model developers, hyperscalers, chipmakers, and the wider market—to give you a complete picture of where the AI boom stands.